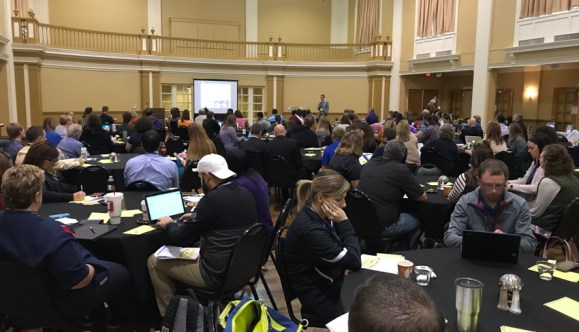
 Several weeks ago, I had the chance to work with a group of high school teachers as we brainstormed new Inquiry Design Models. Any time I get the chance to spend time with a bunch of other social studies teachers, not much can ruin the day. Seriously . . . a whole day talking, sharing, playing with, and exploring the best social studies tools, resources, and strategies?
And during our time together we messed around with a tool that I had almost forgotten about.
The Pie Chart.
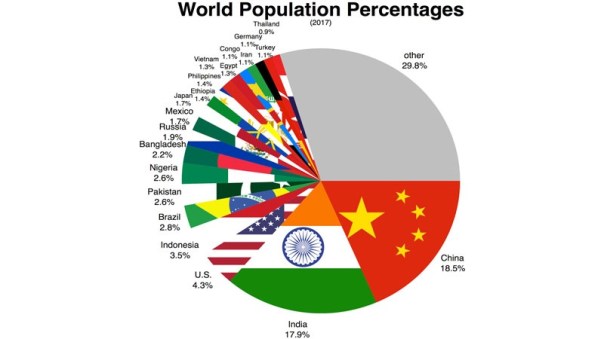
The Pie Chart is a powerful graphic organizer / writing scaffold / assessment tool / Swiss army knife. It does it all and is drop dead simple. I first learned about the Pie almost a decade ago from social studies super star Nathan McAlister.
Nate was part of our Teaching American History grant as the summer seminar master teacher and used the Pie Chart as a hook activity to kick start a conversation about the causes of the Civil War.
Steps he took: Continue reading Need a super simple assessment tool? Make a pie.
 One of the new initiatives in my school district during the 18-19 school year has been to begin a Project Based Learning community. This is a group of teachers who came in over the summer for two full days of training, and have continued to meet quarterly during the school year to learn about PBL together and support each other as they implement PBL in their own classrooms.
 I recently ran into a guy named Michael following a session at a social studies conference. Michael teaches history in a large, urban high school with a ton of low SES and ELL kids. His situation seemed so desperate to me that I had to ask him what strategies he used to convey content and meaning, how he got kids to makes sense of historical information.
 We all love the Stanford History Education Group. What’s not to like? You get incredible lessons aligned to the NCSS C3 standards. And for us Kansas folks, they aligned perfectly to our state standards. They great for training kids to use evidence, think historically, and develop arguments with evidence.